
Research paper · 4 November 2026
The Algorithmic Athlete: Full-Stack Biometrics and Predictive Load Modelling
How wearable sensors, data pipelines and workload models are used to manage athletes in elite sport, and where the evidence for those models runs out.
By Vedant · 9 min read · 15 sources
Edited for publication and checked against the sources listed at the end.
1. Introduction: The Evolution of Quantitative Sports Science
For decades, elite athletic coaching relied primarily on qualitative observation, subjective athlete reporting, and empirical intuition. Coaches evaluated player fatigue through physical signs of exhaustion, rating of perceived exertion (RPE) scales, or post-match performance drop-offs. While useful, these subjective measures can miss micro-level physiological strain, subtle movement asymmetries, or autonomic fatigue prior to the onset of tissue damage.
The sports industry has now undergone a technological paradigm shift. High-performance athlete programmes no longer treat the human body as an isolated black box; instead, they treat the athlete as a complex, quantifiable system generating continuous data streams. Driven by advancements in micro-electro-mechanical systems (MEMS), wireless communication protocols, and cloud-native software architectures, sports organisations now collect gigabytes of real-time telemetry from every training session and match.
2. Thesis Statement
This paper explores the end-to-end integration of wearable technology, Inertial Measurement Units (IMUs), and biometric sensors within modern athletics. It demonstrates how full-stack data pipelines—spanning hardware ingestion, edge routing, time-series data storage, and load models like the Acute:Chronic Workload Ratio (ACWR)—enable workload monitoring that helps staff manage recovery and lower the risk of soft-tissue injuries in elite sports.
3. High-Level Full-Stack System Architecture Overview
To process physical movement into actionable intelligence, sports technology platforms rely on a four-tier full-stack architecture:
- Hardware & Sensor Layer: Wearable GPS pods, tri-axial accelerometers, gyroscopes, and optical heart-rate monitors worn directly on the athlete’s body.
- Edge Ingestion Layer: Sideline receiver units and mobile gateways that collect low-latency wireless telemetry streams via Bluetooth Low Energy (BLE) or Ultra-Wideband (UWB) protocols.
- Backend & Cloud Computing Layer: Scalable cloud infrastructure hosting time-series databases, streaming ingestion pipelines (e.g., Apache Kafka), and algorithmic engines that compute mechanical and physiological load metrics.
- Frontend & Visualisation Layer: Mobile and web-based coach dashboards (built with modern frameworks like React) that present real-time telemetry, historical trend lines, and automated injury risk alerts.
4. Hardware, Sensor Technologies, and Data Ingestion
The foundation of any full-stack sports telemetry platform is the hardware layer worn by the athlete. To capture physical movement without impeding performance, sports scientists rely on micro-electro-mechanical systems (MEMS) housed within lightweight compression vests or wearables.
4.1 Inertial Measurement Units (IMUs)
While satellite positional tracking measures broad field positioning, Inertial Measurement Units (IMUs) measure high-frequency mechanical forces acting on the athlete’s body. An elite sports IMU integrates three core micro-sensors [1]:
- Tri-Axial Accelerometer: Measures directional acceleration forces (g-force) along the lateral (X), anteroposterior (Y), and vertical (Z) axes. Operating at high sampling rates (typically 100 Hz to 1000 Hz), accelerometers detect micro-impacts, foot strikes, and abrupt change-of-direction decelerations.
- Tri-Axial Gyroscope: Tracks rotational velocity (degrees per second) around the three spatial axes, providing rotational context during jumping, bowling, pitching, or tackles.
- Magnetometer: Measures magnetic field orientation to establish absolute spatial heading, reducing directional drift in gyro calculations.
4.2 Positional Tracking: GPS vs. GNSS
GPS is one satellite system, run by the USA. Global Navigation Satellite Systems (GNSS) is the umbrella term for all of them, including Europe’s Galileo, Russia’s GLONASS, and China’s BeiDou [2]. Spatial tracking pods utilise GNSS operating at 10 Hz to 18 Hz (capturing 10 to 18 data points per second). High sampling rates are critical: standard 1 Hz commercial GPS (found in basic smartwatches) has known limitations with rapid high-speed running (HSR) spikes and short 5-metre acceleration efforts common in field sports. A 2016 review found 10 Hz the most valid and reliable rate, with no added benefit at 15 Hz [3].
4.3 Biometric Optical Sensors (PPG)
To measure physiological strain, optical Photoplethysmography (PPG) sensors project LED light into subcutaneous micro-vascular tissue. By measuring changes in light absorption caused by blood volume pulses with every heartbeat, the system derives resting heart rate, peak heart rate, and Heart Rate Variability (HRV) [4].
4.4 Edge Communication Protocols
Because raw IMU sensors sample at high frequencies (100 Hz or more), a single team generates millions of data points per session. Wearables rely on short-range wireless standards to move this telemetry and to locate players:
- Bluetooth Low Energy (BLE 5.0+): Utilised for power-efficient post-session data syncing and short-range streaming.
- Ultra-Wideband (UWB): Provides high-precision indoor local positioning (sub-metre accuracy) where traditional GPS signals fail inside covered stadiums or indoor arenas.
5. Workload Analytics and Algorithmic Load Modelling
Once raw sensor data is ingested, the full-stack backend processes time-series data streams into actionable performance metrics. In sports science, workload is categorised into External Load (the mechanical work performed) and Internal Load (the body’s internal physiological reaction to that work).
5.1 External vs. Internal Load Metrics
- External Load (Mechanical Work): Measures physical movement executed by the athlete on the field. Derived from IMUs (tri-axial accelerometers for g-force impacts, tri-axial gyroscopes for rotational velocity, and magnetometers for spatial orientation), together with GNSS pods for spatial distance and velocity.
- Internal Load (Physiological Stress): Measures metabolic strain and autonomic recovery responses inside the body. Captured via optical PPG sensors and ECG chest straps tracking heart rate zones and Heart Rate Variability (HRV). Athletes’ own session ratings of perceived exertion (session-RPE) are also among the most commonly collected measures [5].
5.2 The Acute:Chronic Workload Ratio (ACWR)
- Acute Workload (7 Days): Captures short-term fatigue resulting from recent training strain and match loads.
- Chronic Workload (28 Days): Captures historical conditioning, physical preparation, and fitness adaptations over a rolling 28-day window.
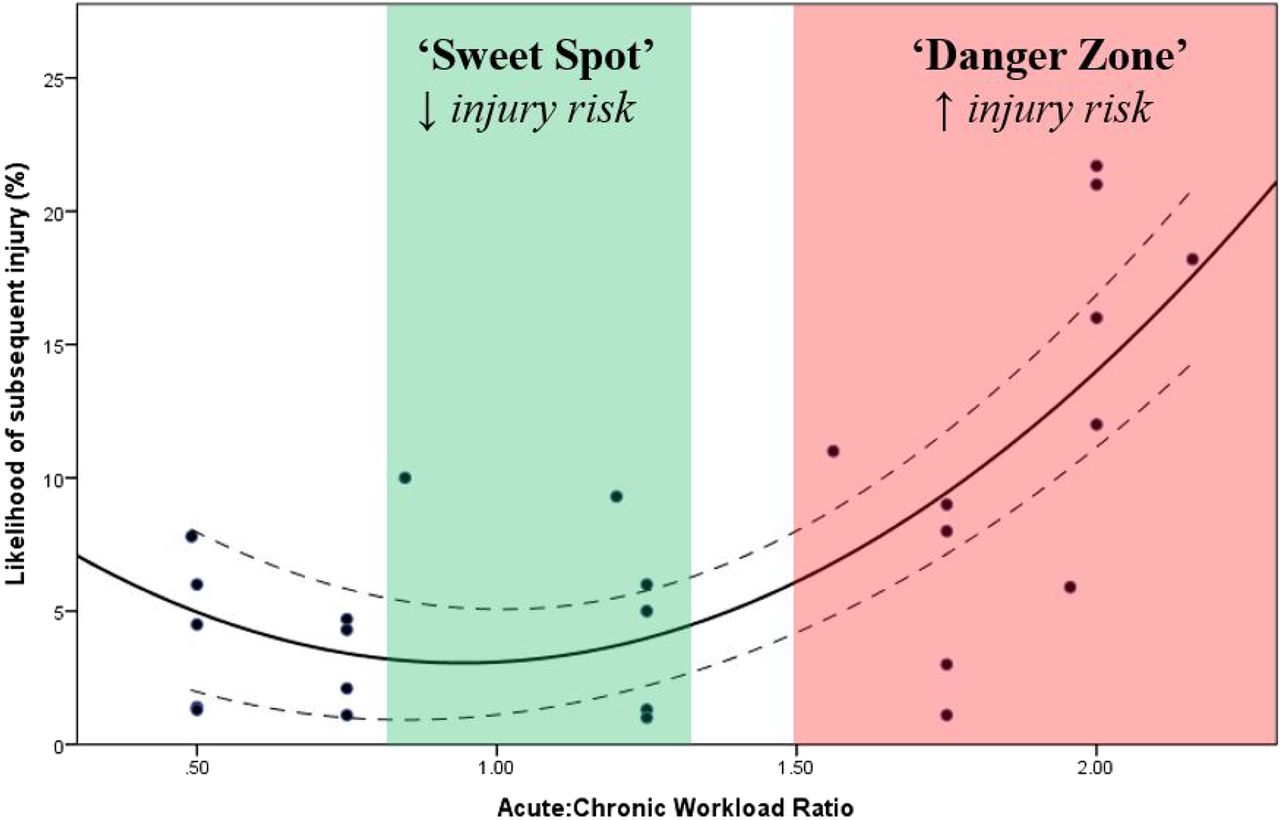
The most popular workload model in injury prevention is the Acute:Chronic Workload Ratio (ACWR) [6]. It quantifies the balance between short-term fatigue and long-term physical preparation:
- Under-Training Zone (ACWR < 0.8): Workload drops significantly below baseline, which can lead to a loss of physical conditioning.
- Optimal Training Zone (0.8 ≤ ACWR ≤ 1.3): Fitness builds while maintaining a relatively low risk of soft-tissue strain [7].
- Caution Band (1.3 < ACWR < 1.5): Not classified as either zone, but above the range recommended for keeping injury risk low [7].
- Danger / Spike Zone (ACWR ≥ 1.5): Fatigue outpaces structural adaptation, and studies link this zone to much higher injury risk: in cricket fast bowlers, 2–4 times greater over the following seven days [7]. Cloud backends evaluate this ratio daily to automatically highlight high-risk athletes.
6. Frontend Dashboards, Real-Time Visualisation, and Recovery Systems
Processing millions of biometric and spatial data points in backend databases is only half the equation. For a sports science platform to be effective during high-stakes training or live matches, data must be transformed into clear, intuitive visual interfaces for coaching, medical, and strength staff.
6.1 Real-Time UI/UX Visual Cues
Rather than presenting raw numerical streams, frontend interfaces apply threshold-based visual cues. Live measures such as high-speed running update during a session, while ACWR is recalculated daily:
- Green (Optimal State): Athlete operating within their optimal ACWR corridor (0.8–1.3).
- Yellow (Caution State): High-speed running or heart-rate accumulation approaching maximum physical thresholds.
- Red (High-Risk Spike): Acute workload spike (ACWR ≥ 1.5) or abnormal movement asymmetry detected, triggering an alert on the coach’s tablet for tactical rotation or workload reduction.
6.2 Autonomic Nervous System Recovery Tracking
In addition to on-field workload, full-stack biometric platforms capture off-field recovery data to evaluate autonomic nervous system (ANS) recovery. Using overnight PPG optical tracking, platforms measure two core metrics:
- Resting Heart Rate (RHR): An elevated resting heart rate can indicate incomplete cardiovascular recovery or systemic fatigue.
- Heart Rate Variability (HRV): Measures the micro-variation in time intervals between consecutive heartbeats (R-R intervals on an ECG; PPG sensors estimate the same thing from pulse intervals). Compared with an athlete’s own baseline, higher HRV generally indicates strong parasympathetic nervous system activity (high readiness), while suppressed HRV can signal sympathetic dominance, high physiological strain, and inadequate recovery. Even so, higher is not always better [8].
7. Real-World Applications, Technical Limitations, and Conclusion
7.1 Real-World Case Studies in Elite Sport
Full-stack biometric and workload tracking architectures are currently deployed across top-tier international sports organisations:
- International Cricket (BCCI / ECB): Fast bowlers generate ground reaction forces that often exceed six times their body weight during delivery [9]. Squads utilise IMUs and GPS to monitor ball-by-ball workloads [10] [11], keeping fast bowlers within target workload ranges to help reduce the risk of injuries such as lumbar stress fractures.
- Association Football (Premier League / UEFA): Compression vests with 10 Hz GPS/GNSS tracking monitor total match distances (around 10–12 km per match [12]) and high-speed running thresholds, helping technical staff make data-driven substitution decisions.
- American Football (NFL): Ultra-Wideband (UWB) tracking is installed in every NFL venue, not just indoor ones. RFID tags in players’ shoulder pads are read by 20–30 receivers around the stadium, recording location, speed, distance, and acceleration 10 times per second [13].
7.2 Technical Limitations and Signal Noise
While full-stack sports technology provides unprecedented visibility into performance, engineers and sports scientists must work around key limitations:
- GPS Signal Degradation: Stadium roofs and indoor arenas block GNSS satellite line-of-sight. Software architectures must dynamically fall back on localised UWB or optical camera systems.
- Sensor Motion Artefacts: High-impact movements cause wearable pods to shift against the athlete’s body, introducing mechanical noise into IMU data streams. Backends must apply digital filtering algorithms (such as Butterworth or Kalman filters) to separate real human movement from hardware vibration.
- Contextual Gaps: Wearables measure mechanical work executed, but cannot measure mental fatigue, tactical stress, or external environmental factors (e.g., extreme heat or altitude) without manual input. Self-reported measures still matter: one systematic review found they tracked training load with better sensitivity and consistency than common objective measures [14].
- Contested Evidence: ACWR is associated with injury, but it has not been shown to cause it. Most studies in one systematic review linked a higher ratio to greater injury risk, but their methods varied so widely that this limits how strongly it can be recommended [5]. No study has properly estimated a causal effect [6], and one re-analysis found ACWR offered no meaningful predictive advantage and called for it to be dismissed [15]. The zones above are a guide, not a rule.
7.3 Conclusion: The Future of Quantitative Athletic Performance
The integration of full-stack software architecture with quantitative sports science has permanently transformed human performance engineering. By routing continuous physical movement through hardware sensors, low-latency edge ingestion networks, cloud-native time-series engines, and intuitive real-time dashboards, sports organisations no longer have to rely on guesswork alone to manage athlete health.
Models like the Acute:Chronic Workload Ratio (ACWR) show how data pipelines can turn raw movement into a daily signal for managing soft-tissue injury risk, although whether they actually reduce injuries is still debated. As edge processing becomes faster and machine learning models incorporate predictive biometric forecasting, the “Algorithmic Athlete” represents not the replacement of human coaching intuition, but its ultimate technological evolution.
Sources
- Trends Supporting the In-Field Use of Wearable Inertial Sensors for Sport Performance Evaluation: A Systematic Review — Camomilla et al., Sensors, 2018
- What is GNSS? — EU Agency for the Space Programme
- The Validity and Reliability of Global Positioning Systems in Team Sport: A Brief Review — Scott, Scott and Kelly, Journal of Strength and Conditioning Research, 2016
- A review on wearable photoplethysmography sensors and their potential future applications in health care — Castaneda et al., International Journal of Biosensors & Bioelectronics, 2018
- Is the Acute:Chronic Workload Ratio (ACWR) Associated with Risk of Time-Loss Injury in Professional Team Sports? A Systematic Review of Methodology, Variables and Injury Risk in Practical Situations — Andrade et al., Sports Medicine, 2020
- Acute:Chronic Workload Ratio: Conceptual Issues and Fundamental Pitfalls — Impellizzeri et al., International Journal of Sports Physiology and Performance, 2020
- The training-injury prevention paradox: should athletes be training smarter and harder? — Gabbett, British Journal of Sports Medicine, 2016
- An Overview of Heart Rate Variability Metrics and Norms — Shaffer and Ginsberg, Frontiers in Public Health, 2017
- Biomechanical Evolution in Longitudinal Analysis of Lumbar Stress Injuries in Fast Bowlers: A Systematic Review — Arun et al., Cureus, 2025
- How the BCCI Centre of Excellence is shaping India's high-performance system — BCCI, 2026
- Athlete Monitoring Technology Helping to Drive Performance in Elite Cricket — Catapult, 2019
- A critical evaluation of the aerobic capacity demands of elite male soccer players — Shalfawi and Tjelta, International Journal of Applied Sports Sciences, 2016
- NFL Next Gen Stats — NFL Football Operations
- Monitoring the athlete training response: subjective self-reported measures trump commonly used objective measures: a systematic review — Saw, Main and Gastin, British Journal of Sports Medicine, 2016
- What Role Do Chronic Workloads Play in the Acute to Chronic Workload Ratio? Time to Dismiss ACWR and Its Underlying Theory — Impellizzeri et al., Sports Medicine, 2021